고정 헤더 영역
상세 컨텐츠
본문
728x90
멋쟁이사자처럼 X K-DIGITAL Training - 06.14
스크랩한 기사로 텍스트 데이터 분석 및 워드클라우드 만들기
라이브러리
import numpy as np
import pandas as pd

import nltk
from konlpy.tag import Okt

import matplotlib
import matplotlib.pyplot as plt
from matplotlib import font_manager, rc

from wordcloud import WordCloud
from PIL import Image
from wordcloud import ImageColorGenerator
numpy 벡터, 행렬 등 수치 연산을 수행하는 선형대수 라이브러리
pandas 데이터프레임 생성하여 행과 열의 데이터를 다룰 수 있게 해줌
konlpy 한국어 정보처리를 위한 파이썬 패키지 (Hannanum, Kkma, Komoran, Mecab 등의 라이브러리에서 제공)
nltk 자연어 처리를 위한 파이썬 패키지
matplotlib 데이터를 차트로 시각화
wordcloud.WordCloud 워드클라우드 생성
wordcloud.ImageColorGenerator 이미지로부터 컬러 생성하는 객체
PIL.Image 이미지 분석 및 처리 라이브러리
텍스트 데이터 분석
뉴스 기사 파일 불러오기
df = pd.read_excel('result_210623_1312.xlsx', encoding = 'utf-8')
* 문자열과 리스트 사이 변환
s = 'python is easy'

# string -> list
result = s.split()
print(result) # ['python', 'is', 'easy']

# list -> string
result2 = '_'.join(result)
print(result2) # python_is_easy
기사의 본문(df.Article) 모아서 하나의 리스트로 모음
# series -> list
articles = df.Article.tolist(
리스트를 다시 하나의 문자열로 변환
articles = ''.join(articles)
단어 정규화 및 어근화, 품사 태깅
텍스트 데이터 전처리
정제(cleaning)
노이즈 데이터 제거
정규화 (normalization)
일반화된 문장으로 되돌려줌, 표현 방법이 다른 단어들을 통합시켜 같은 단어로 만들어줌
예) 한국어를 처리하는 예시입니닼ㅋㅋㅋㅋㅋ
→ 한국어를 처리하는 예시입니다 ㅋㅋ
토근화 (tokenization)
코퍼스(corpus)에서 토큰(token)이라 불리는 단위로 나누는 작업
문장의 단어 분리, 여기서 토큰은 의미있는 단어로 정의
예) 한국어를 처리하는 예시입니다 ㅋㅋ
→ 한국어Noun, 를Josa, 처리Noun, 하는Verb, 예시Noun, 입Adjective, 니다Eomi, ㅋㅋKoreanParticle
어근화 (stemming)
사전형으로 되돌려줌
예) 한국어를 처리하는 예시입니다 ㅋㅋ
→ 한국어Noun, 를Josa, 처리Noun, 하다Verb, 예시Noun, 이다Adjective, ㅋㅋKoreanParticle
불용어 (stopword) 제거
분석에 큰 의미가 없는 단어 제거
nltk에서 17개의 언어에 대해 불용어가 정의되어 있음 (한국어 제외)

노이즈 데이터 제거
articles = articles.replace('(', '')
articles = articles.replace(')', '')
articles = articles.replace(' \n', '')
articles = articles.replace('\n', '')
articles = articles.replace('\'', '')
품사 태깅 : 각 단어에 대응하는 품사를 붙이는 일
twitter = Okt()
raw_pos_tagged = twitter.pos(articles, norm = True, stem = True)
- norm: 정규화
- stem: 어근화

단어 등장 빈도 카운팅
불용어 제거
# 무의미한 단어 리스트
del_list = ['하다', '있다', '되다', '이다', '돼다', '않다', '그렇다', '아니다', '이렇다', '그렇다', '어떻다']
# append하여 커스텀 가능 - 기자 이름 추가
del_list.append('김형')

word_cleaned = []
for word in raw_pos_tagged: # ('서울', 'Noun'),

    if not word[1] in ["Josa", "Eomi", "Punctuation", "Foreign", "Number"]:
        if (len(word[0]) != 1) & (word[0] not in del_list):
            word_cleaned.append(word[0])
- 조사, 어미, 문장부호, 특수문자, 숫자 등 제거
- 한 글자로 이뤄진 단어는 의미없다고 가정하여 삭제

단어 빈도 count
1) 리스트 반복문
word_dic = {}

for word in word_cleaned:
    if word not in word_dic: # 처음 등장할 시
        word_dic[word] = 1
    else: # 추가 등장시 count ++
        word_dic[word] += 1
2) Counter 라이브러리
from collections import Counter

result = Counter(word_cleaned)
word_dic = dict(result)
워드클라우드
word_dic.items() # dict
lambda 함수를 활용하여 내림차순 정렬
sorted_word_dic = sorted(word_dic.items(), key = lambda x:x[1], reverse = True)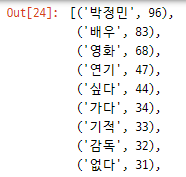
단어 등장 빈도 matplot 시각화
- 꺾은선 차트 (nltk)
word_counted = nltk.Text(word_cleaned)
plt.figure(figsize=(15, 7))
word_counted.plot(50)
- 막대그래프 (nltk + pandas dataframe)
word_frequency = nltk.FreqDist(word_cleaned) # 단어 빈도 계산

# {단어(key): 수(value)} -> 데이터프레임
df = pd.DataFrame(list(word_frequency.values()), word_frequency.keys())

# 빈도 내림차순 정렬
result = df.sort_values([0], ascending=False)

# matplot 그래프
result.plot(kind = 'bar', legend = False, figsize = (25,10), rot=0, fontsize=14) # 'bar' graph
plt.show()

워드클라우드
기본
word_cloud = WordCloud(font_path="C:/Windows/Fonts/malgun.ttf", # 폰트설정
                       width=2000, height=1000, # 워드클라우드 크기(해상도)
                       prefer_horizontal= 0.8, # 가로방향 단어 비율 (0~1)
                       background_color='white',
                       colormap = 'Set2')

word_cloud.generate_from_frequencies(word_dic)

plt.figure(figsize=(15,15))
plt.imshow(word_cloud) # image show
plt.axis("off")
plt.tight_layout(pad=0)
plt.show()
- font_path: 폰트 설정
- width, height: 워드클라우드 크기(해상도와도 관련)
- prefer_horizontal: 가로방향 단어의 비율(0~1)
- background_color: 배경색
- colormap: 글씨 색상
- max_word: 최대 단어 수

마스킹 적용 - 특정 그림 테두리 내에 워드클라우드 그리기

cloud_shape = np.array(Image.open("image/wordcloud3.jpg"))

word_cloud = WordCloud(font_path="C:/Windows/Fonts/malgun.ttf", # font_path="C:/Windows/Fonts/NanumSquareB.ttf"
                       width=2000, height=1000,
                       mask=cloud_shape,
                       background_color='white',
                       colormap='RdPu').generate_from_frequencies(word_dic)

plt.figure(figsize=(15,15))
plt.imshow(word_cloud)
plt.axis("off")
plt.tight_layout(pad=0)
plt.show()

이미지의 색상 적용
cloud_shape = np.array(Image.open("image/wordcloud3.jpg"))
image_colors = ImageColorGenerator(cloud_shape)

word_cloud = WordCloud(font_path="C:/Windows/Fonts/malgun.ttf", # font_path="C:/Windows/Fonts/NanumSquareB.ttf"
                       width=2000, height=1000,
                       mask=cloud_shape,
                       background_color='white').generate_from_frequencies(word_dic)

plt.figure(figsize=(15,15))

plt.imshow(word_cloud.recolor(color_func=image_colors), interpolation='bilinear') # 다시(re) 색칠하기
# plt.imshow(word_cloud.recolor(colormap='Blues'), interpolation='bilinear') # Matplotlib colormap 활용 (http://j.mp/32UXOQ6)

plt.axis("off")
plt.tight_layout(pad=0)
plt.show()
이미지파일로 저장
word_cloud.to_file('word_cloud_heart.png')
728x90
'PYTHON > K-DIGITAL' 카테고리의 다른 글
| [K-DIGITAL] 파이썬 Selenium으로 크롤링하기(2) + SQLite (0) | 2021.06.28 |
|---|---|
| [K-DIGITAL] 파이썬 Selenium으로 크롤링하기(1) (0) | 2021.06.25 |
| [K-DIGITAL] 파이썬 웹 크롤링 - 뉴스 기사 스크랩(2) (0) | 2021.06.23 |
| [K-DIGITAL] 파이썬 웹 크롤링 - 뉴스 기사 스크랩 (0) | 2021.06.23 |
| [K-DIGITAL] 세미프로젝트1. 서울시 자전거사고 분석(4) 추가, 수정 (0) | 2021.06.22 |
댓글 영역